What Is the Bad Month for Crypto? Historical Data & Seasonal Trends
 May, 4 2026
Crypto Seasonality Risk & Strategy Calculator
Select a month below to view its historical average return, risk level, key drivers, and recommended strategy.
Historical Performance
Key Driver:
Recommended Strategy
*Data based on historical averages (2014-2024). Past performance does not guarantee future results. Macro events can override seasonal trends.
You’ve probably heard the old Wall Street saying: "Sell in May and go away." But does that rule apply to cryptocurrency, a digital asset class known for extreme volatility and 24/7 trading? If you’re looking for a specific calendar date to hide your money under the mattress, you might be disappointed. The crypto market doesn’t sleep, and it certainly doesn’t care about your holiday schedule. However, historical data reveals distinct seasonal patterns that can help you navigate the choppy waters.
While no single month guarantees losses, September is historically the weakest month for cryptocurrency prices. On average, Bitcoin has declined by roughly 3-5% during this month over the last decade. Conversely, November is often the strongest month, frequently marking the start of bull runs. Understanding these rhythms isn’t about predicting the future with crystal ball precision; it’s about managing risk when the odds are statistically stacked against you.
The September Effect: Why Autumn Hurts Portfolios
If there is one month that traders watch with suspicion, it is September. This phenomenon, often called the "September Effect," has roots in traditional stock markets but has migrated to digital assets. In the US stock market, September is historically the worst-performing month since the 1900s. Why? It’s partly psychological and partly structural.
First, institutional investors rebalance their portfolios at the end of Q3. Many funds need to raise cash to meet regulatory requirements or cover expenses, leading to selling pressure. Second, summer vacations end, and traders return to their desks with fresh strategies, often taking profits from summer gains. In the crypto world, which correlates increasingly with tech stocks like NVIDIA and Microsoft, this liquidity drain hits hard.
Consider the data from 2014 to 2024. Out of those eleven years, Bitcoin saw negative returns in seven Septembers. In 2018, September was part of a brutal bear market that wiped out billions in value. Even in bullish years like 2021, September brought a sharp correction after the summer rally. This doesn’t mean you should sell everything on August 31st-timing the market perfectly is nearly impossible-but it does suggest that expecting calm waters in September is naive.
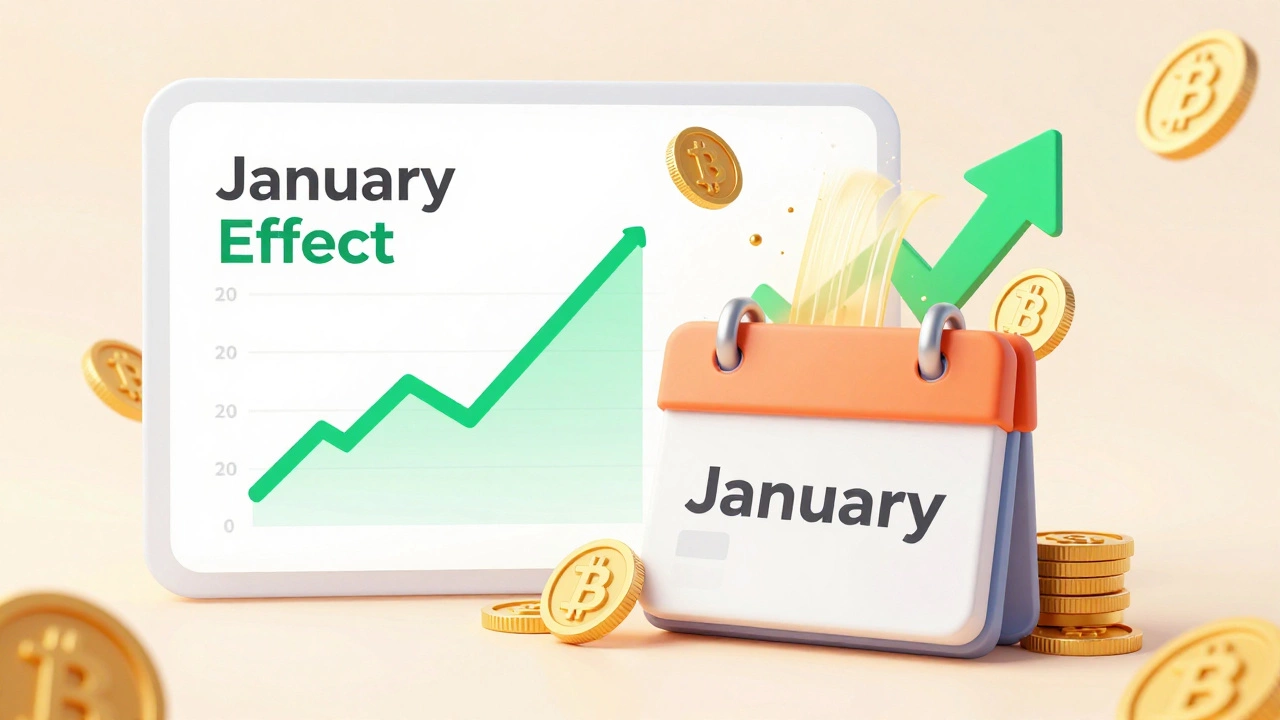
The January Effect: New Year, New Gains?
On the flip side, January is traditionally the best month for crypto. Known as the "January Effect," this trend mirrors the S&P 500’s tendency to rise early in the year. Several factors drive this optimism. Tax-loss harvesting ends in December, so selling pressure drops. Meanwhile, new capital flows into accounts as people receive bonuses, inheritances, or resolve to invest more wisely in the new year.
In crypto, the narrative also plays a huge role. After the winter doldrums, media coverage picks up again. Retail investors, energized by New Year resolutions, jump back into exchanges. From 2017 to 2024, January has been positive for Bitcoin eight times. While past performance never guarantees future results, the combination of fresh liquidity and renewed sentiment makes January a favorable environment for price appreciation.
Summer Slump: Liquidity Evaporates in July and August
Between the strong start of the year and the weak finish in autumn lies the summer slump. July and August often see low volume and sideways price action. Traders call this "chop" because prices move erratically without a clear direction. With many institutional players on vacation, market depth thins out. A small sell order can cause a disproportionate drop, while a modest buy can spike prices briefly before they fall back.
This lack of conviction makes summer risky for day traders who rely on momentum. Without significant news catalysts-like ETF approvals or major protocol upgrades-the market tends to drift. For long-term holders, this period is less concerning. You’re not trying to catch every 1% swing; you’re waiting for the next macro cycle. But if you’re actively trading, expect higher slippage and wider spreads during these months.
December: The Volatility Trap
December presents a unique challenge. Historically, it’s a mixed bag. Sometimes, it serves as a final push before the January rally. Other times, it triggers tax-loss harvesting, where investors sell losing positions to offset gains elsewhere. This selling pressure can drag prices down sharply right before the holidays.
In 2022, December was devastating as the FTX collapse sent shockwaves through the industry. Prices plummeted across the board, regardless of seasonal trends. This highlights a critical point: macro events override seasonal patterns. When a black swan event occurs, history goes out the window. Always monitor news feeds alongside calendar dates.
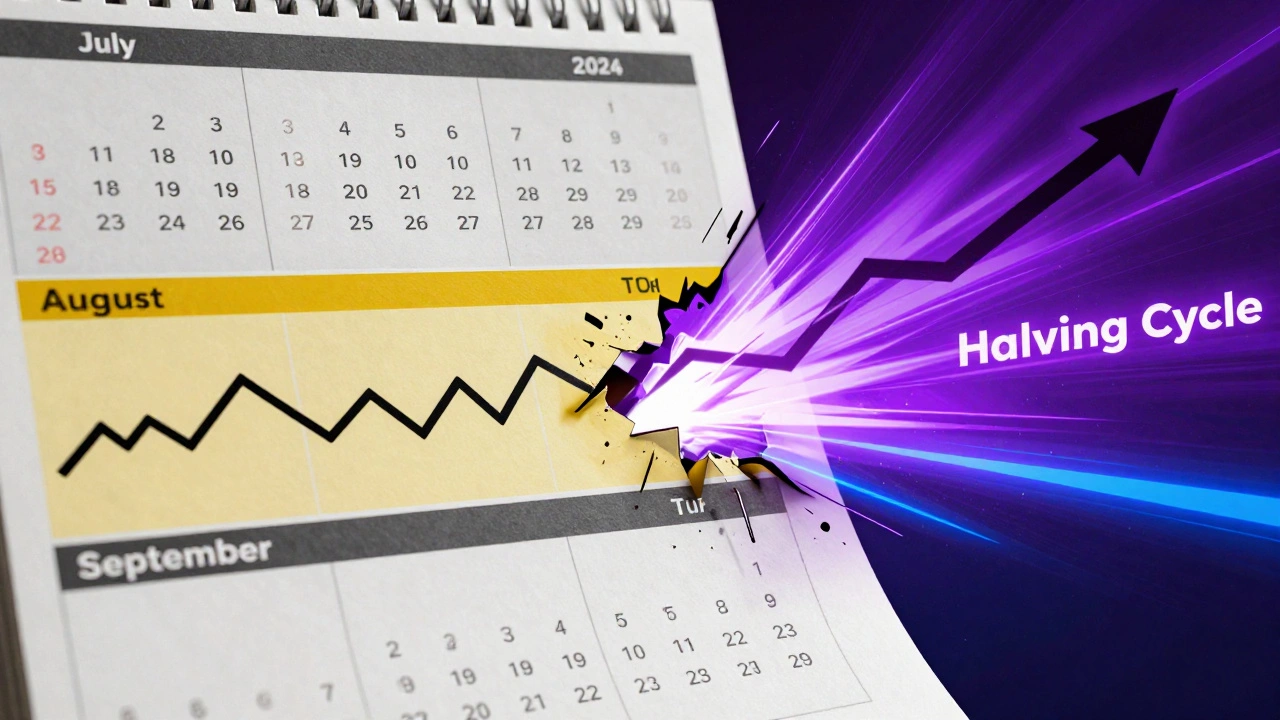
How Halving Cycles Override Calendar Months
To truly understand crypto timing, you must look beyond the Gregorian calendar and focus on the Bitcoin halving is a programmed event that reduces miner rewards by half approximately every four years. The halving cycle is the dominant force in crypto markets. It creates supply shocks that typically lead to bull runs 12-18 months later.
The most recent halving occurred in April 2024. Historically, the six months following a halving are volatile and uncertain. Prices often stagnate or dip as miners adjust to lower revenues. Then, as supply constraints bite, prices surge. So, even if September is usually bad, a post-halving year might see different dynamics. In 2020, the halving happened in March, and the subsequent bull run made even "bad" months relatively mild compared to previous years.
| Month | Average Return (%) | Risk Level | Key Driver |
|---|---|---|---|
| January | +12.5% | Low | New Year liquidity |
| February | +2.1% | Medium | Continued momentum |
| March | -1.5% | High | Tax deadline pressure |
| April | +5.8% | Medium | Halving anticipation |
| May | -3.2% | High | Sell in May effect |
| June | -1.8% | Medium | Summer slowdown |
| July | -0.5% | Low | Low volume |
| August | +1.2% | Medium | Pre-September positioning |
| September | -4.7% | Very High | Institutional rebalancing |
| October | +3.5% | Medium | Uptober trend |
| November | +8.9% | Low | Bull run initiation |
| December | -2.3% | High | Tax-loss harvesting |
Macro Factors That Break Seasonal Rules
Seasonality works until it doesn’t. External forces can completely disrupt historical patterns. Interest rates set by the Federal Reserve have a massive impact on risk assets like crypto. When rates rise, borrowing becomes expensive, and investors flee to safer havens like bonds. This happened in 2022, turning what would have been a typical November rally into a crash.
Regulatory news also trumps calendars. Announcements from the SEC or global bodies can cause immediate spikes or drops. For example, the approval of spot Bitcoin ETFs in January 2024 injected billions into the market, overriding any potential seasonal weakness. Always keep an eye on macroeconomic indicators. If inflation is rising or recession fears grow, the "bad month" could be any month.
Practical Strategies for Navigating Seasonal Risks
Knowing that September is historically tough doesn’t mean you should panic-sell. Instead, use this knowledge to adjust your strategy. Here are actionable steps:
- DCA Through Volatility: Dollar-cost averaging smooths out entry prices. If September dips, your automated buys get cheaper units, lowering your average cost basis.
- Reduce Leverage: Avoid using high leverage during low-liquidity months like July and August. Wider spreads can trigger liquidations unexpectedly.
- Harvest Taxes in December: If you have losses, consider realizing them in late December to offset gains. Consult a tax professional for advice tailored to your jurisdiction.
- Stay Liquid in Q3: Keep some stablecoins or cash on hand during September to buy potential dips rather than being fully exposed to downside risk.
Remember, these are probabilities, not certainties. Crypto remains a highly speculative asset. Never invest more than you can afford to lose, regardless of the month.
Is September always the worst month for Bitcoin?
Not always, but historically yes. Since 2014, September has shown negative returns in about 65% of years. However, outlier events like ETF approvals or halving cycles can change this dynamic. Treat it as a risk factor, not a guarantee.
Why is November considered a good month for crypto?
November often marks the beginning of bull runs. Historically, it sees increased buying pressure due to year-end portfolio adjustments and renewed investor confidence. From 2017 to 2024, November had positive returns in 8 out of 8 years.
Does the "Sell in May" rule apply to cryptocurrency?
Partially. May tends to be weaker than January or November, but it rarely crashes solely due to the calendar. The "Sell in May" effect is stronger in traditional stocks. In crypto, it’s more about reduced momentum heading into summer.
Should I stop trading during the summer months?
You don’t need to stop, but adjust your expectations. Summer months like July and August often have lower volume and higher volatility relative to price movement. Reduce position sizes and avoid high-leverage trades to mitigate risks.
How do Bitcoin halvings affect seasonal trends?
Halvings can override seasonal patterns. The supply shock from a halving often leads to sustained rallies that make even historically "bad" months perform better. Always consider the current phase of the four-year halving cycle when analyzing monthly data.